


Business Intelligence in Real Time
Increased sales through data analysis
When numbers blind us, we provide clarity
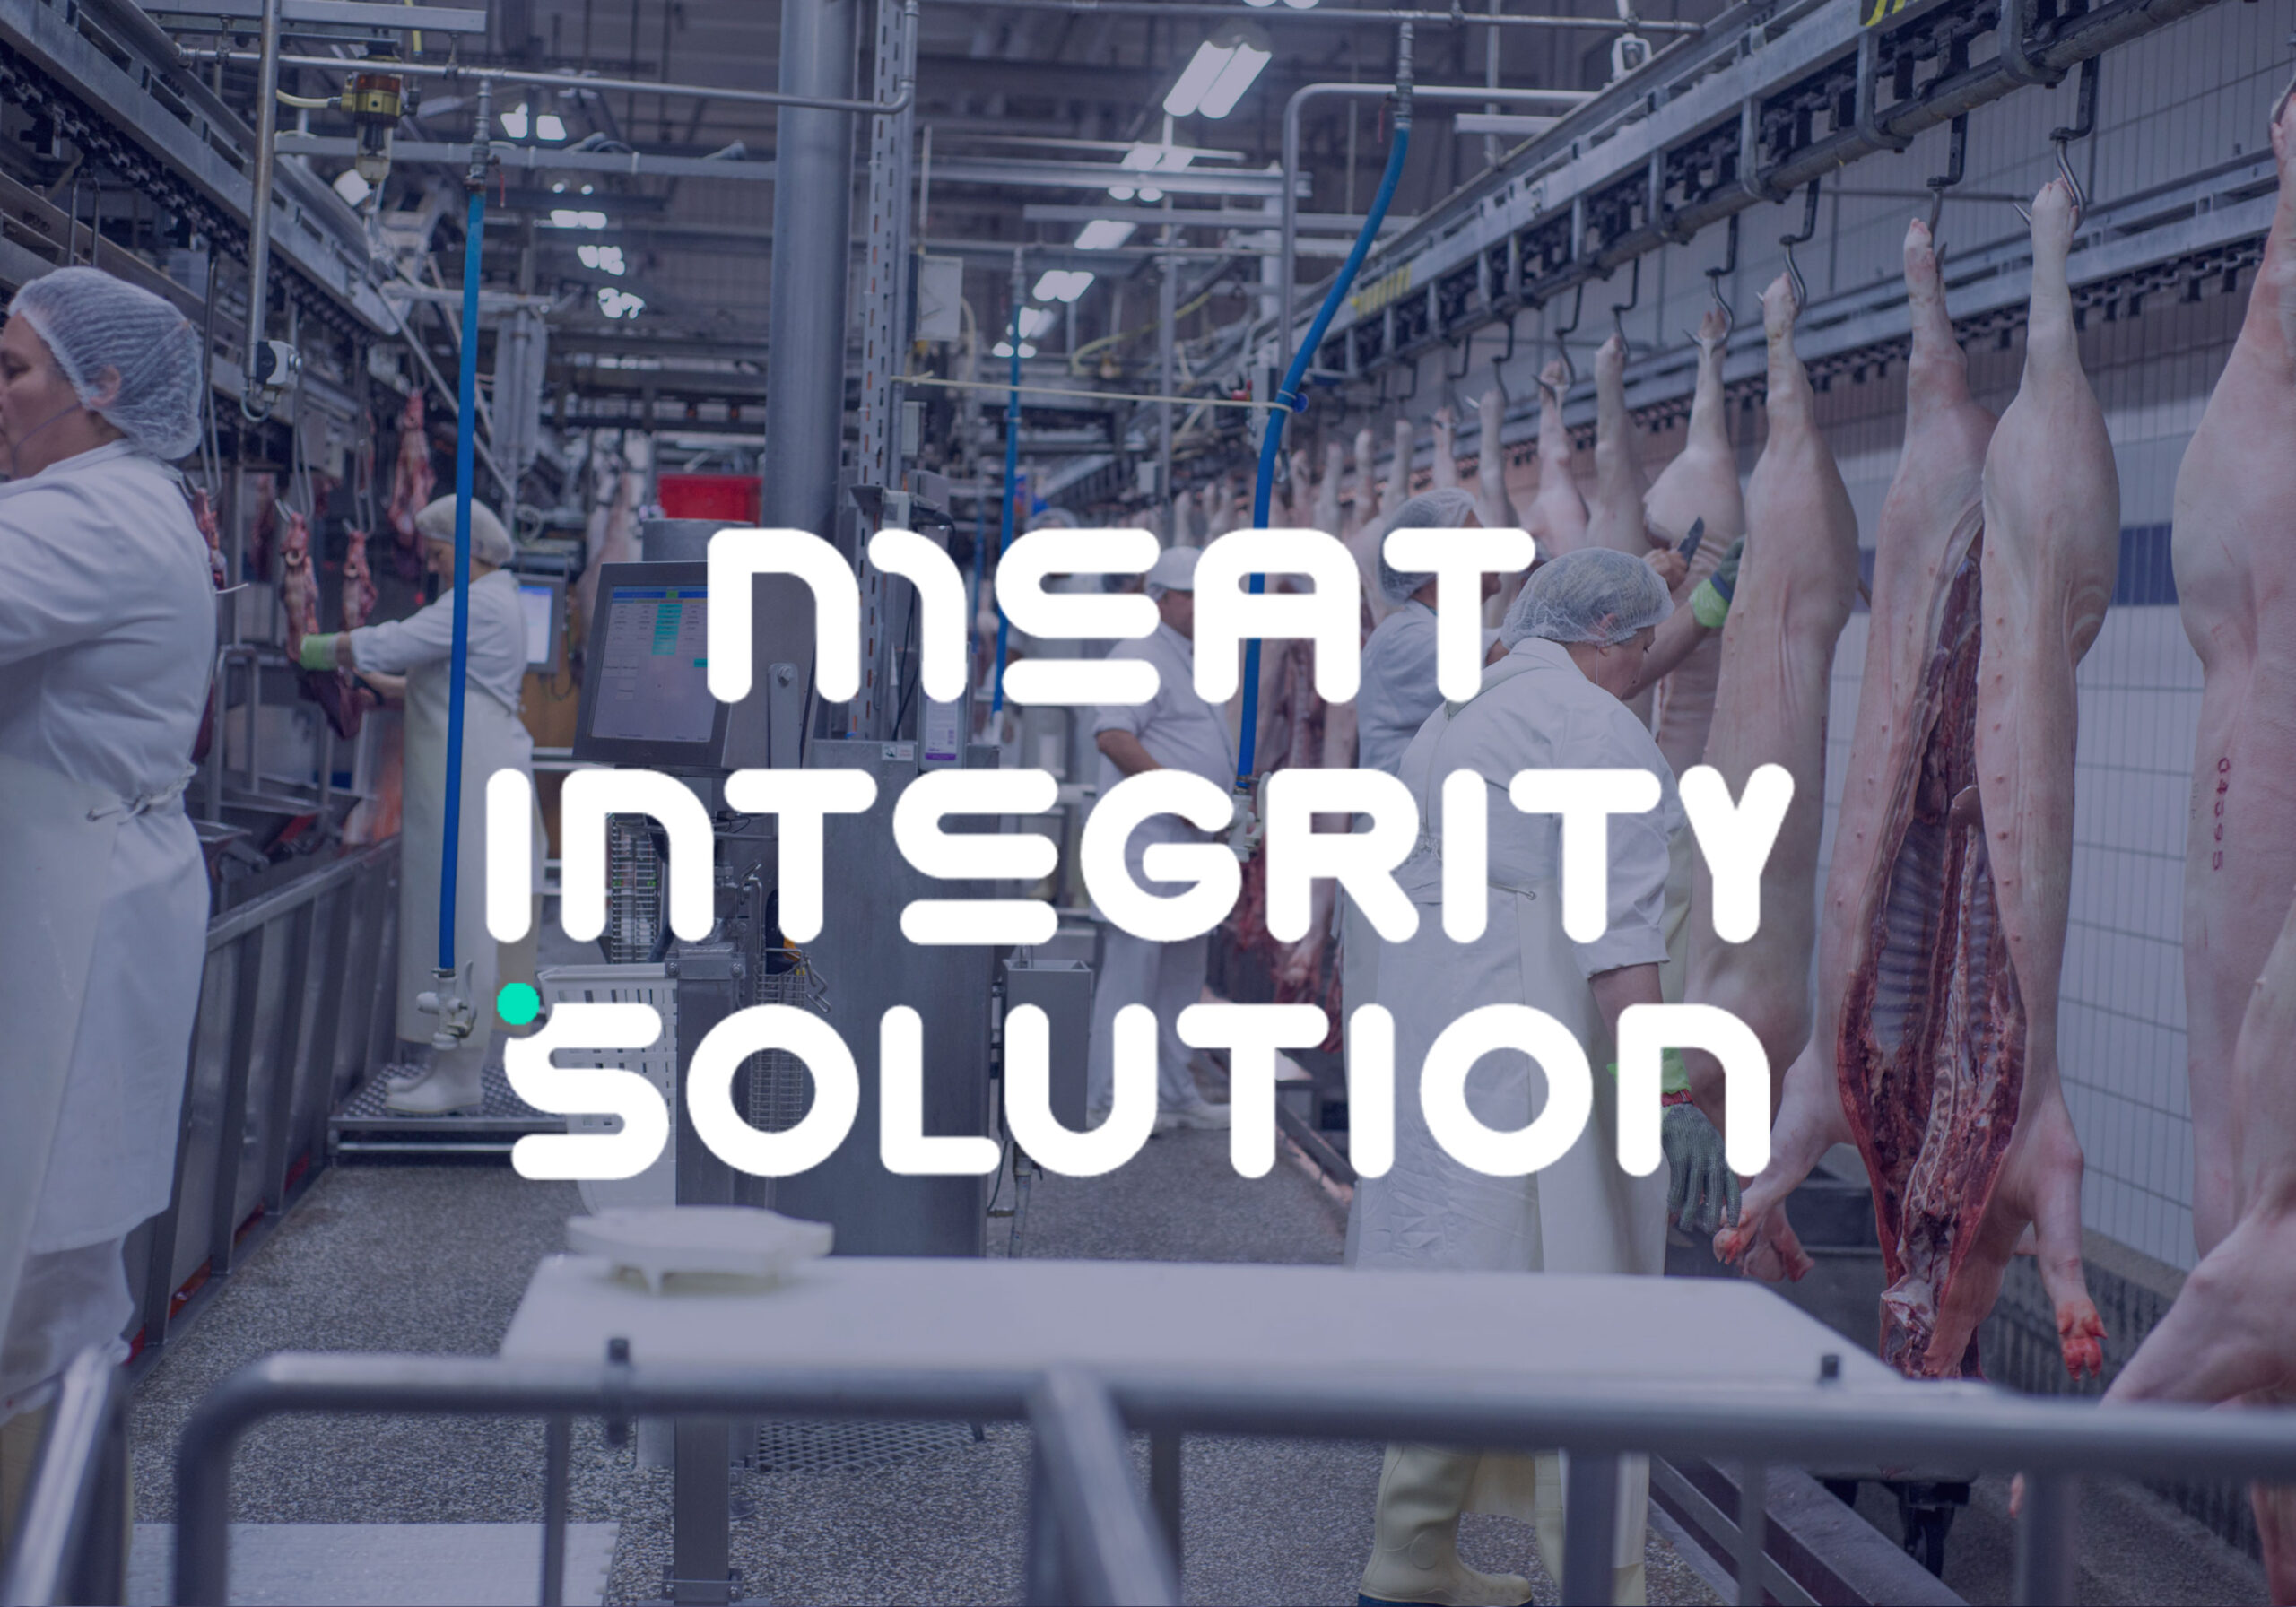
Precision is key in the meat industry.
But many slaughterhouses face
the same challenges:
- Traceability becomes complicated when data is stored in different systems.
- Real-time information is missing, leading to incorrect inventory levels and billing errors.
- Quality and hygiene data are scattered and difficult to evaluate.
- Yield analyses remain inaccurate if data is not consistent.
The result: high manual effort, increasing risks, and a lack of transparency.
Our platform brings together all relevant data from different source systems – quickly, securely, and intuitively.
- Production cockpit: Transparency in further processing – from recipes to batch tracking.
- Inventory analysis: Keep track of stock levels and movements at all times for optimal planning.
- SLA Predict: Use AI-powered forecasts for sales and production planning—for less overproduction and better resource utilization.
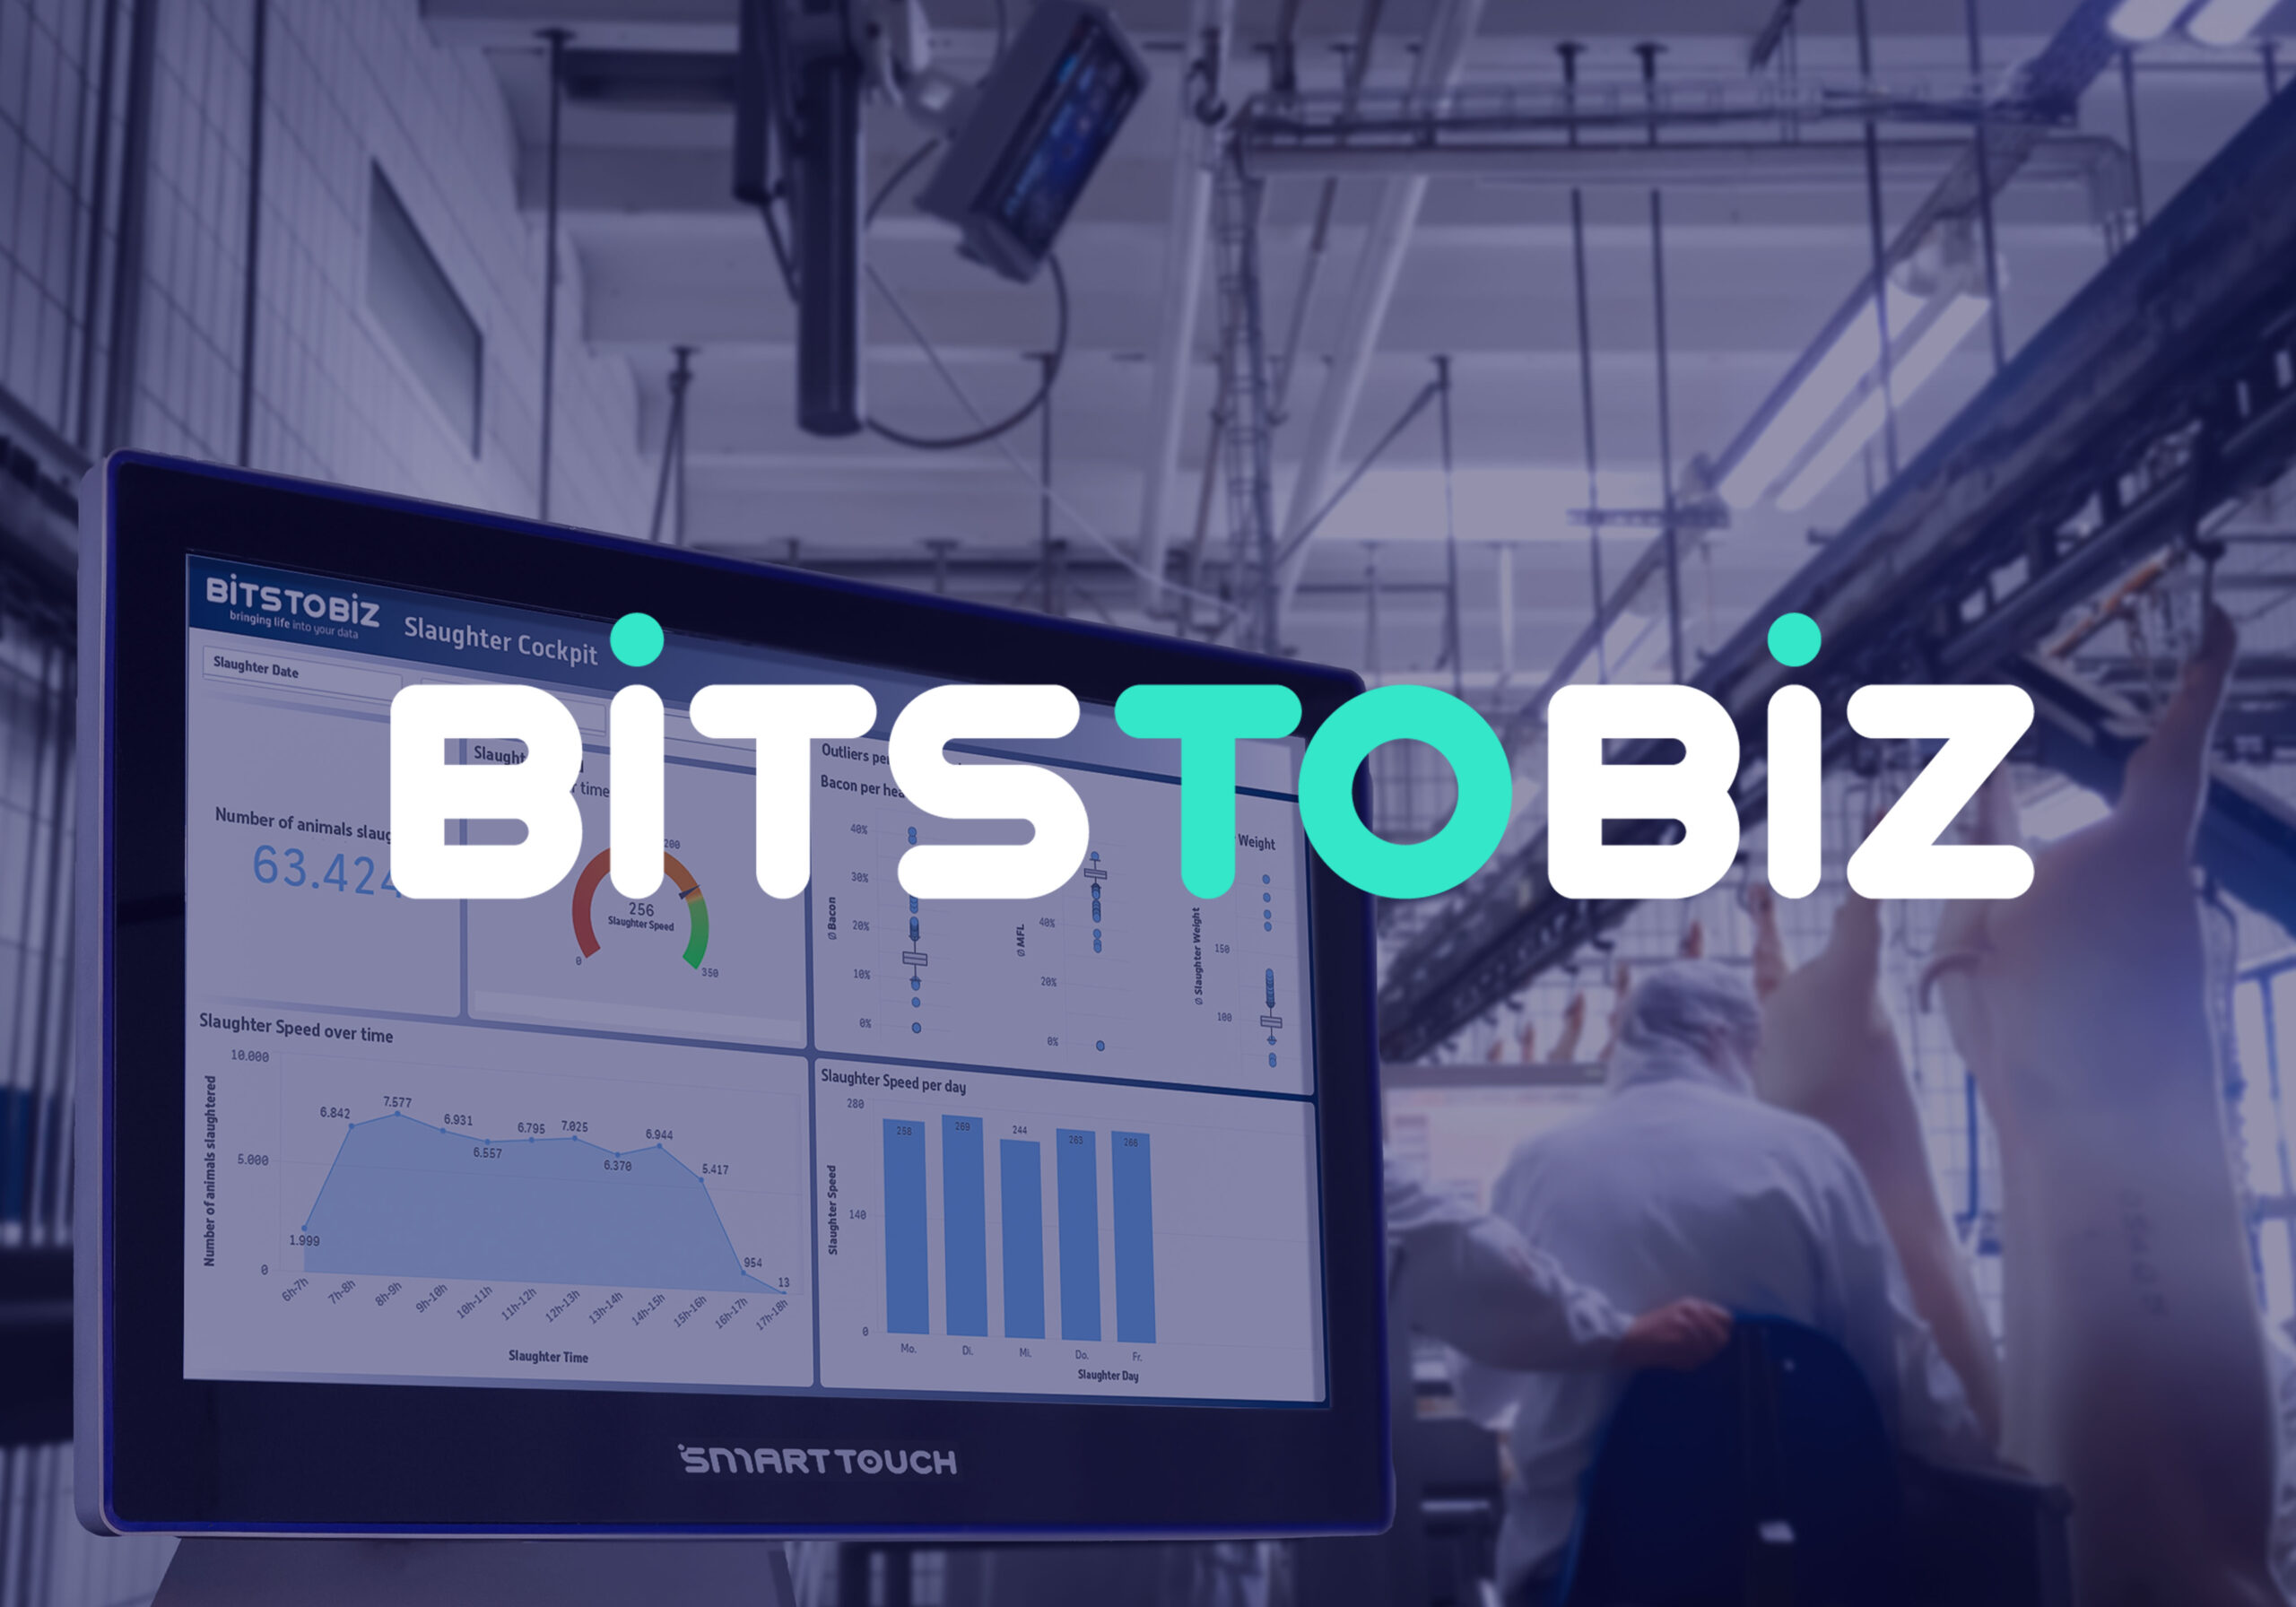
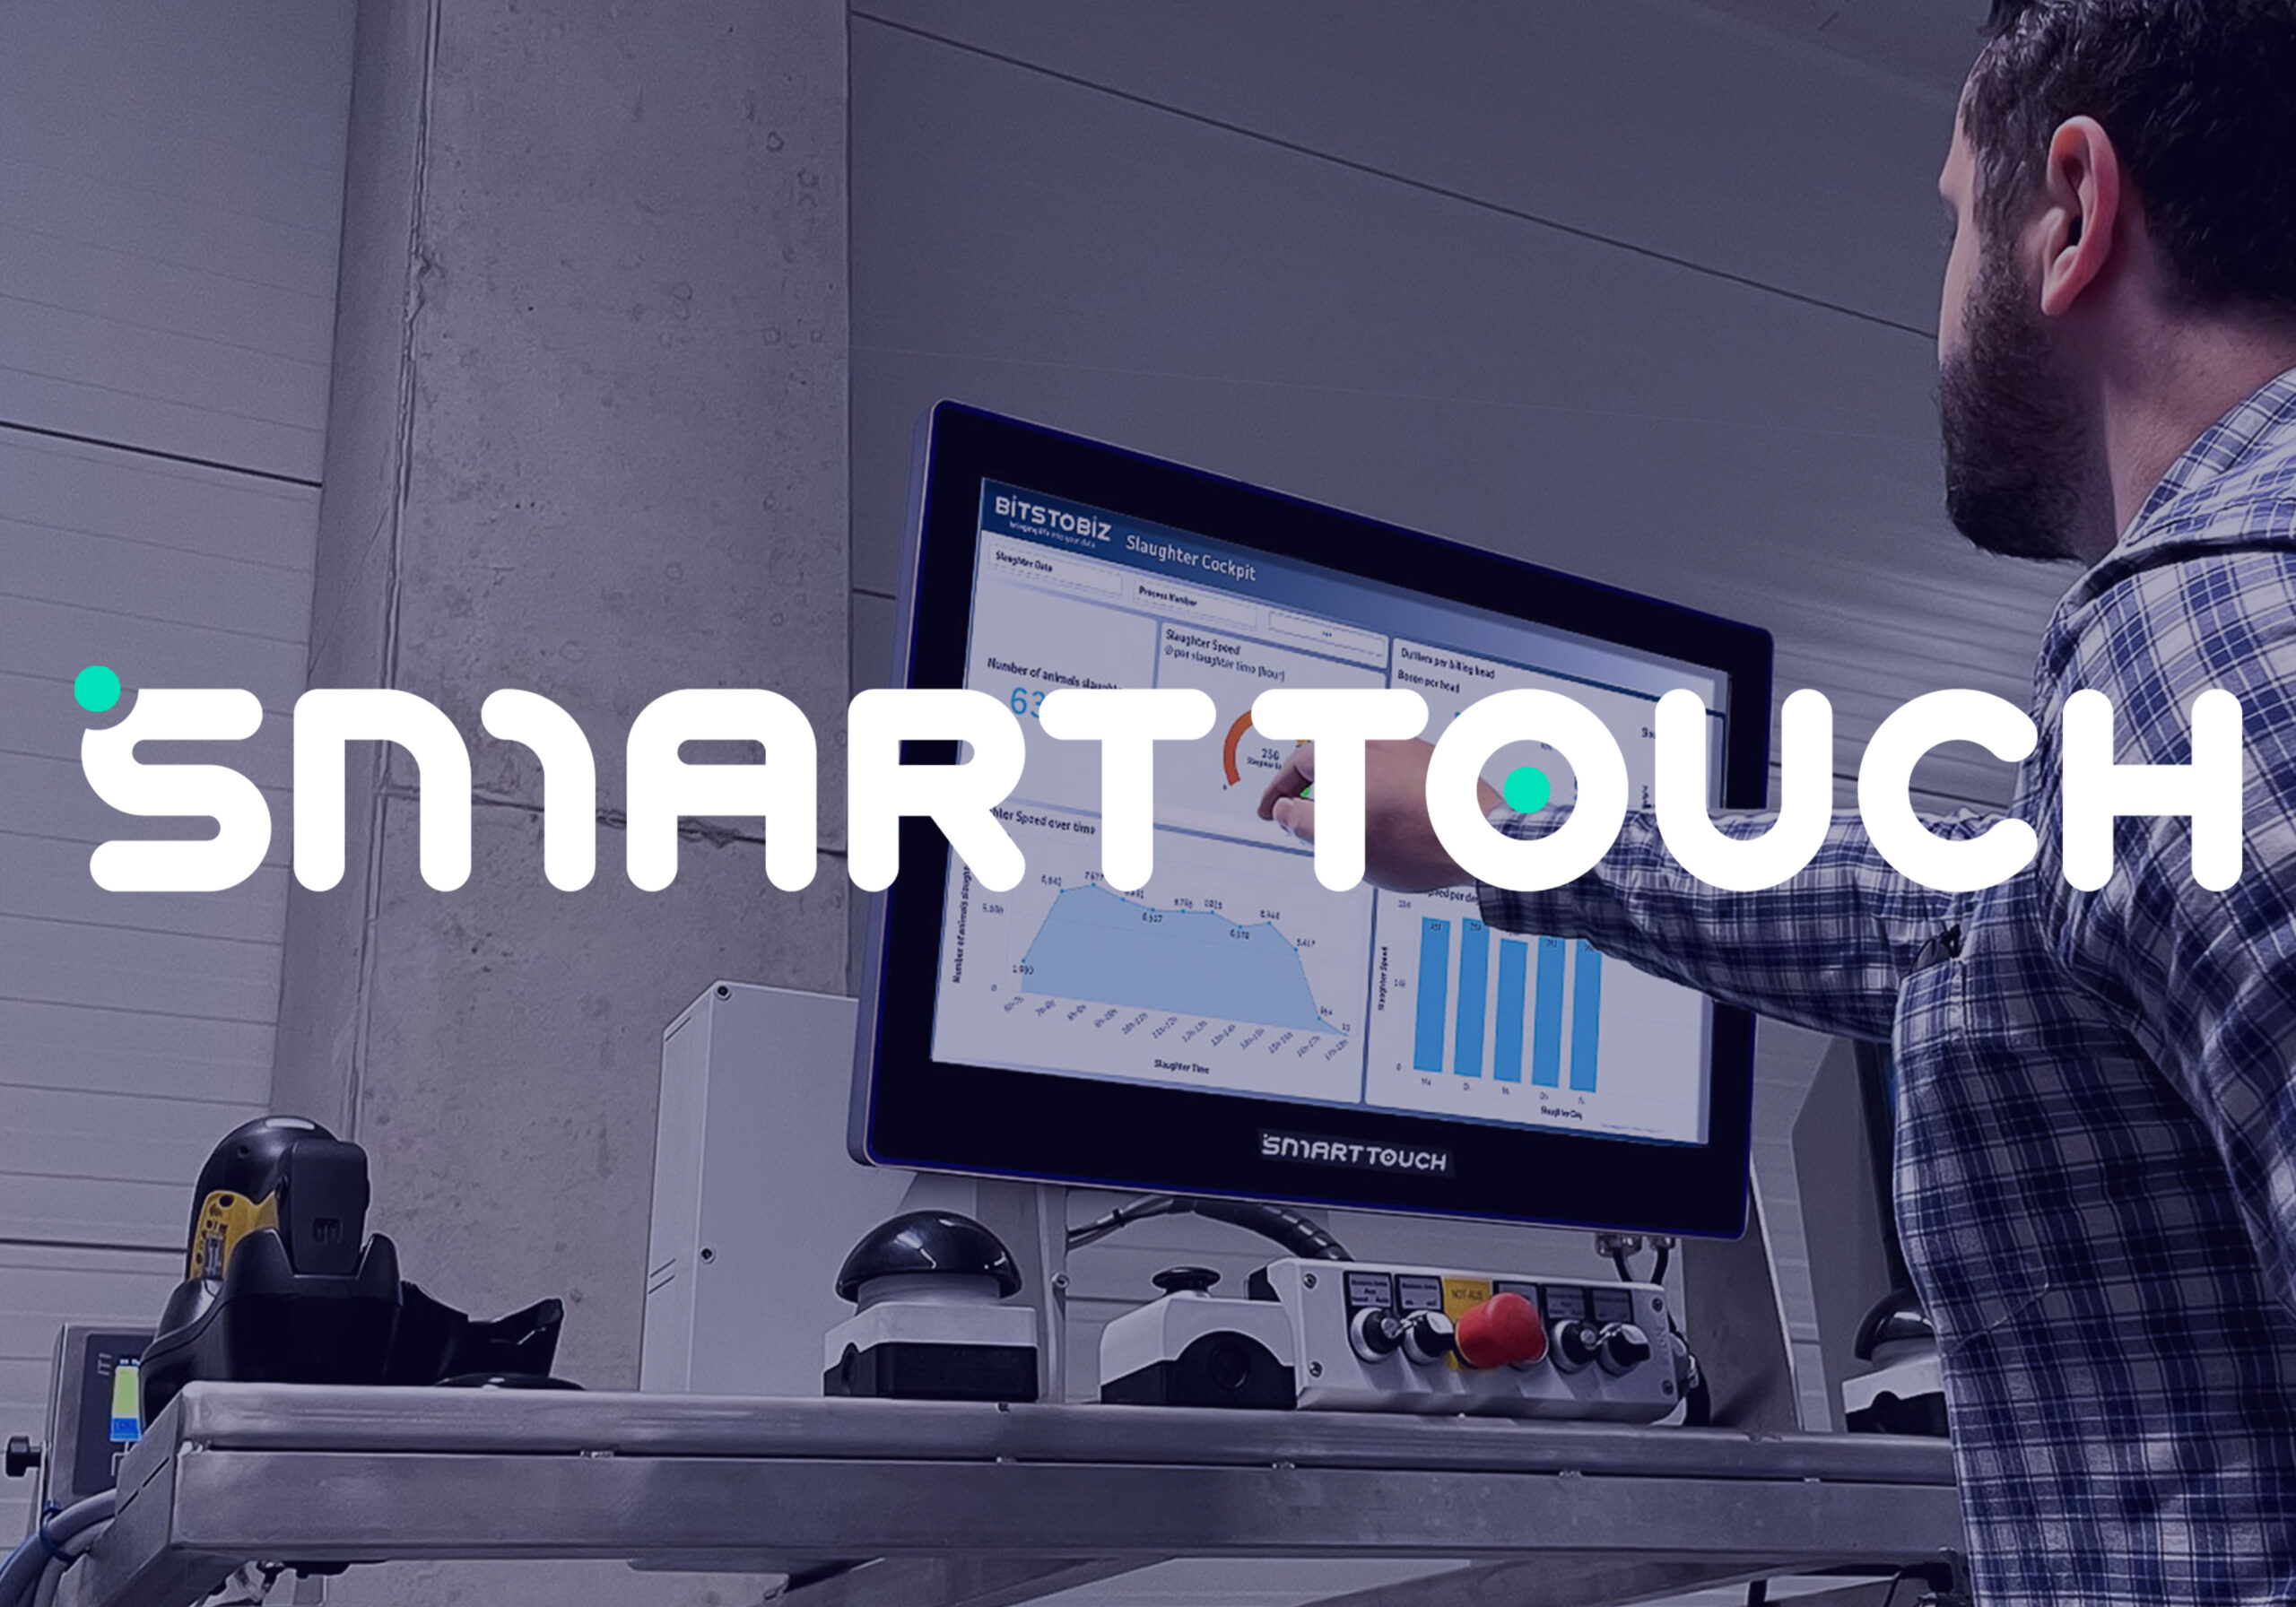
- Slaughter cockpit: Real-time overview of slaughter figures, classification, and yield.
Your advantage
- Full control: All data in one place, available at any time.
- Faster decisions: real-time analyses and forecasts instead of Excel ch
- Compliance made easy: documentation and traceability without stress.
Discover our demo apps and experience how easy data analysis and forecasting can be:
- sales analysis
- inventory analysis
- Slaughter cockpit
- supplier evaluation
- production cockpit
Questions that make decisions easier – FAQs
SLA Analytics is real-time business intelligence: production, warehouse, and sales data flow into a shared live view with standardized KPIs and role-based Qlik dashboards. Unlike static reports, SLA Analytics shows deviations as they occur and prioritizes actions—decisions move from follow-up to operational cycles.
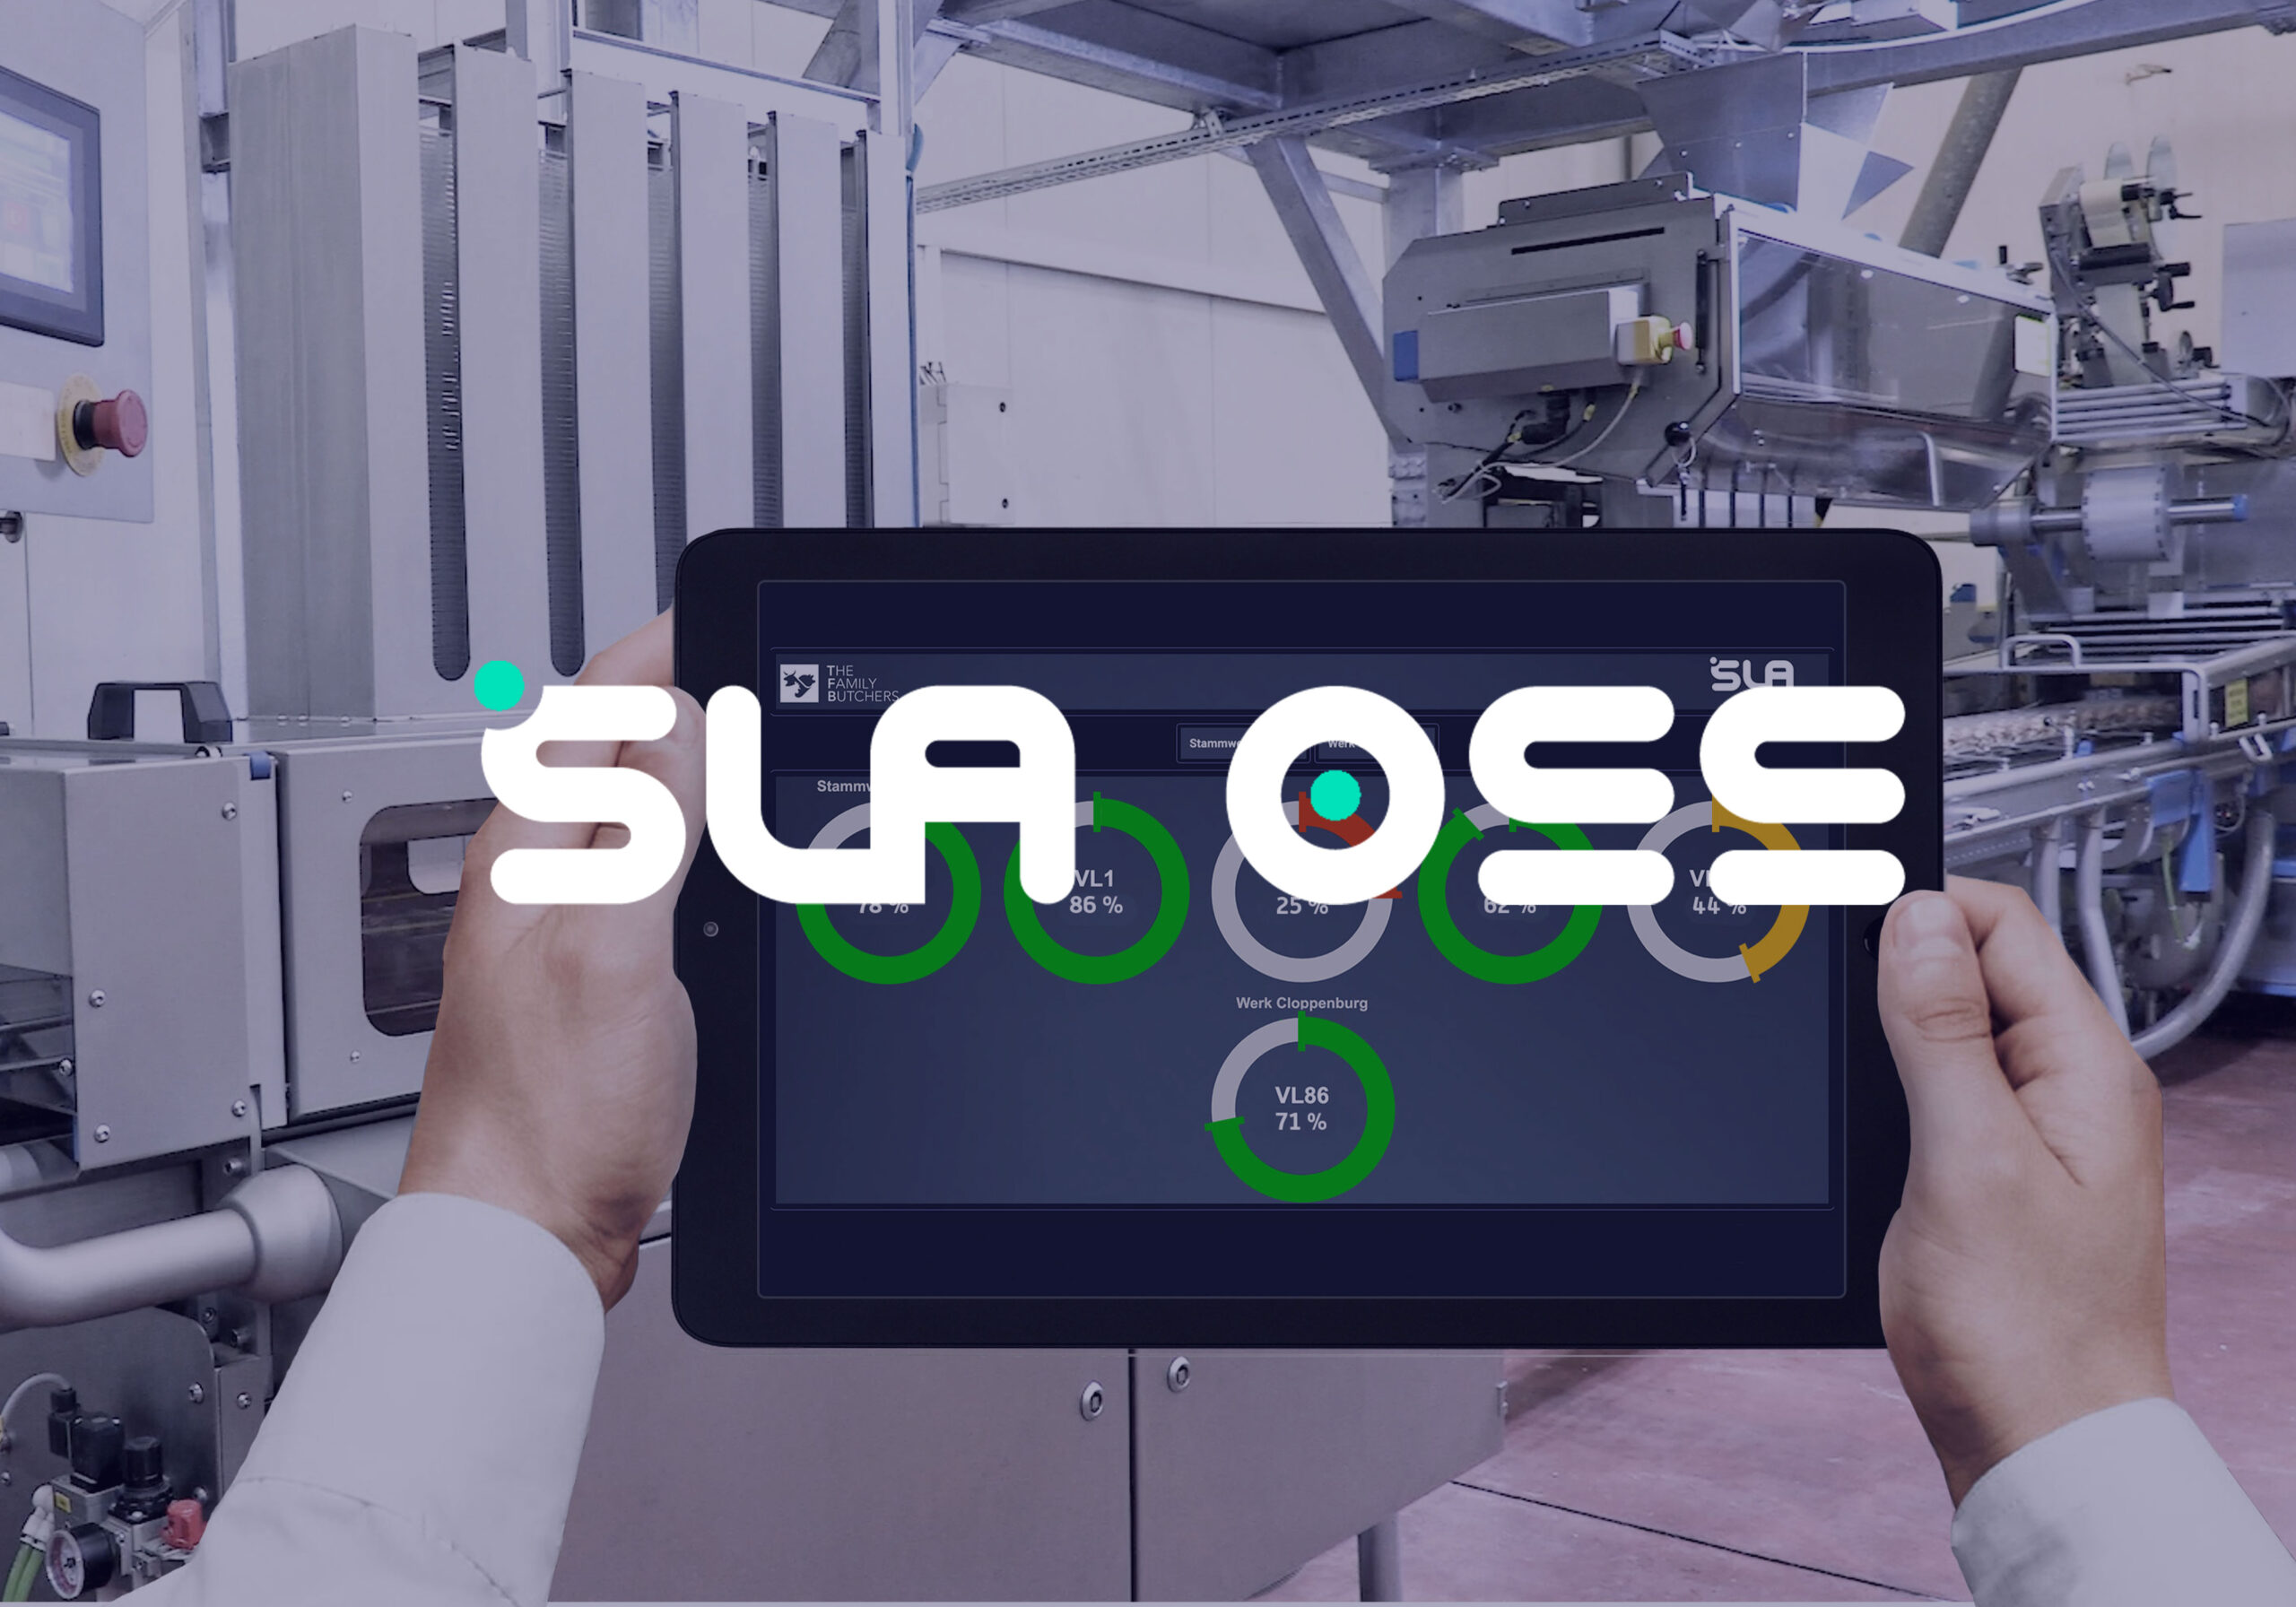
Standard cockpits reflect the core processes: production/slaughter (cycle time, yield), warehouse/inventory (range, turnover, dwell time), sales/sales (top/flops, promotions, trends), logistics/shipping (on-time delivery, capacity utilization), and supplier evaluation (quality, punctuality, temperature, complaints) . Everything is linked – end-to-end view instead of silos.
The demo runs with anonymized sample data and can be accessed in minutes—no data upload required. You can experience real Qlik dashboards with live logic on desktop and mobile, check out the cockpit navigation, and see how deviations, priorities, and KPIs interact.
Each area shows typical daily questions: Where is the production cycle bottleneck? Which ranges are critical? Which items are really selling well? Where are the bottlenecks in logistics? Which suppliers deliver consistently? This quickly gives you a clear sense of the benefits, speed, and usability.
Typical sources include ERP, BDE/MES, WMS/LVS, TMS, scales/IoT, POS/EDI, and even Excel. They are transferred to a consistent model (data lake/warehouse), standardized, and orchestrated in Qlik dashboards—with rights, logging, and GDPR-compliant processing.
The basis for this is clean historical data (quantities, prices, promotions), stable master data (articles, locations), appropriate granularity and frequency, and external factors (weather, season, holidays, promotions). AutoML helps find suitable models faster; forecast quality (MAPE/WAPE) and deviations are visible in the cockpit, allowing forecasts to be used directly for control purposes.
SLA Analytics provides the live picture and shared KPIs; Predictive AI adds a view of the future. The result: more accurate quantities, leaner inventories, greater on-time delivery, and more stable contribution margins. In demand planning, even ±1% accuracy can make a difference of six to seven figures per year—fewer shortages, fewer surpluses.
Yes. SLA Analytics relies on role-based authorization concepts, encryption, and logging. Cloud-based or hybrid operation; sensitive data can be stored locally as needed. Processes are designed to be GDPR-compliant—from data minimization to rights management.